Detailed Notes
In terms of age, the majority of candidates fall within the 41 to 60 years category. A total of 435 candidates, representing around 60 percent, belong to this age group, making it the dominant segment in the election. Meanwhile, 174 candidates, or approximately 24 percent, are aged between 25 and 40 years, indicating relatively lower participation from younger candidates.
Candidates aged between 61 and 80 years account for 113 candidates, or about 16 percent of the total. Overall, the data shows that the electoral contest is largely driven by experienced individuals, with fewer candidates from younger and older age groups.
Age-wise Distribution in Assam Election 2026
- 25 to 40 years: 174 candidates (24%)
- 41 to 60 years: 435 candidates (60%)
- 61 to 80 years: 113 candidates (16%)
The data also highlights that the largest concentration of candidates falls within the 40-49 and 50-59 age brackets, reinforcing the dominance of middle-aged participants in the election.
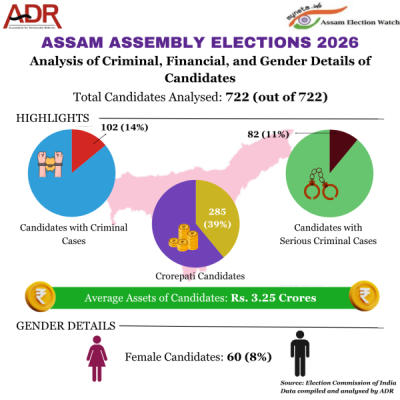
Gender-wise Distribution in Assam Election 2026
- Male candidates: 663
- Female candidates: 59 to 60 (approximately 8%)
Women represent only about 8 percent of the total candidates, which remains unchanged compared to the 2021 Assam Assembly Elections. Despite a reduction in the overall number of candidates after delimitation, the proportion of female candidates has not shown significant improvement.
Party-wise Gender Insights in Assam Election 2026
- BJP: 6 women candidates out of 90
- INC: Around 13 percent of women candidates
- Smaller parties: Slightly higher proportion but low overall numbers
This indicates that women's representation remains limited across major political parties, with only marginal variation among them.